You’ve seen the headline: “Women still do more housework than men.” The data behind it is real — married women do spend more time cleaning, cooking, and doing laundry than married men. But the framing leaves out most of what men actually do around the house. A couple cannot maintain a household on housework alone. Someone has to earn the income that pays for the house. Someone has to commute to that job. Someone has to mow the lawn, repair the sprinklers, coach the little league team, drive the kids to after-school programs, and do the grocery shopping.
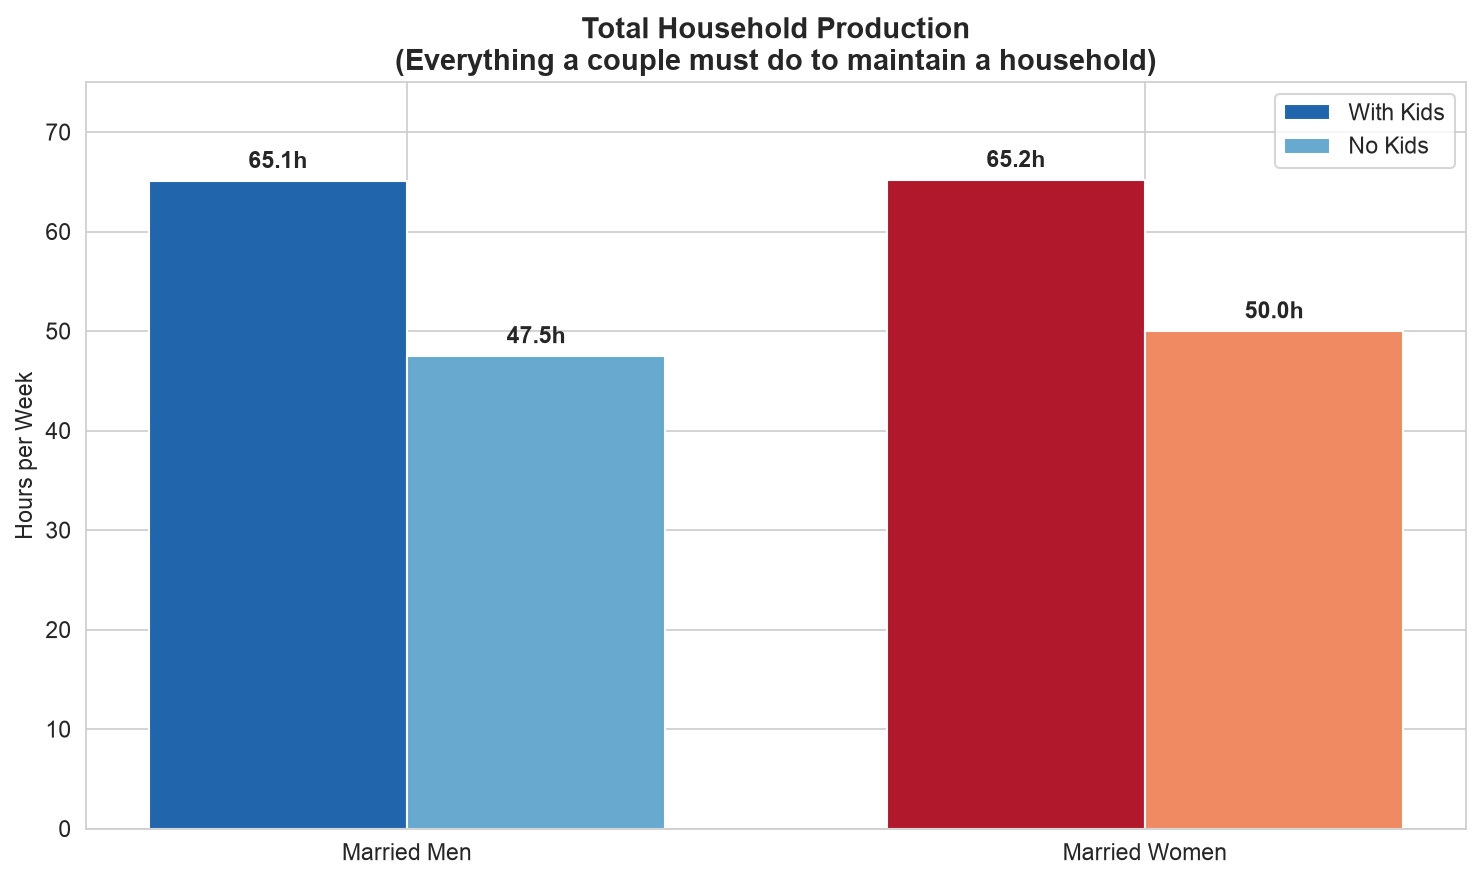
This analysis uses the American Time Use Survey (ATUS) — a large, nationally representative time-diary survey conducted by the Bureau of Labor Statistics — to compare married men and women on total household production: everything a couple is reasonably required to do to maintain a household, with a special focus on couples with children.
What counts as household production?
The ATUS tracks how Americans spend every minute of a 24-hour day, using a detailed 6-digit activity coding lexicon (over 400 distinct activities). We mapped these activities into the following categories — everything a couple must do to keep a household running:
| Category | What’s in it |
|---|---|
| Housework & home maintenance | Interior cleaning, laundry, cooking, food prep & cleanup, interior repairs & decoration, exterior cleaning/repairs, lawn care, landscaping, sprinkler repair, ponds/pools, pet care, vehicle repair, appliance/tool repair, household management & finances |
| Childcare (household) | Physical care, reading, playing, arts & crafts, sports, attending kids’ events, picking up/dropping off (driving kids to school & activities), homework help, school conferences, homeschooling, medical care, plus caring for household adults |
| Care for non-household members | Caring for non-household children (coaching little league, helping with homework, driving to activities), helping non-household adults |
| Market labor | Work at main job, other jobs, work-related activities, income-generating hobbies, job search & interviewing |
| Commute | All travel related to working, work activities, and job search |
| Shopping | Groceries, gas, food purchases, general shopping, comparison shopping |
| Professional & personal services | Banking, financial services, legal services, medical services, paid childcare, personal care, veterinary services |
| Household services | Using repair, maintenance, lawn/garden, vehicle, and cleaning services |
| Civic & government | Civic obligations, government services, licenses/fees/taxes |
| Volunteering | Coaching, mentoring, teaching, leading, building houses/structures, indoor/outdoor maintenance & cleanup, food prep, fundraising, public health & safety, attending meetings |
| Travel for all of the above | Travel to shopping, childcare, volunteering, civic activities — all the driving that maintaining a household requires |
What’s excluded and why
Personal care (sleeping, grooming), eating and drinking, socializing and leisure, sports and recreation, religious activities, education, and phone calls are excluded. These are things people do for themselves or for enjoyment — they are not required labor for household maintenance.
Why include market labor and commute?
This is the key analytical choice. A couple cannot maintain a household without income. The hours spent earning that income — including the commute — are hours not available for other household production. If one partner works 40 hours a week plus 5 hours commuting, those 45 hours are their contribution to household production, just as the other partner’s 15 hours of cooking and 20 hours of childcare are theirs. Both are essential. Both are labor the household requires.
Why include volunteering and community work?
Coaching a kid’s little league team, helping at after-school programs, organizing community events — these are things parents (especially fathers) do as part of maintaining a household with children. They substitute for paid services and are required labor for the household. The ATUS volunteering category (tier 1 code 15) includes teaching, leading, counseling, mentoring, building, maintenance, food preparation, and organizing — all the things that keep a family and community running.
Data and method
Data: ATUS 2018, the most recent pre-pandemic year with full data available. The summary file contains 9,593 respondents, each recording every activity during one diary day. We filter to 4,571 married respondents (spouse present in the household) and split them into four groups:
| Group | Sample size |
|---|---|
| Married men with children | 1,170 |
| Married men without children | 1,083 |
| Married women with children | 1,201 |
| Married women without children | 1,117 |
“Has children” means any household child under 18. All means are weighted
using ATUS final weights (tufinlwgt) to be nationally representative. The
ATUS diary measures a single day; we convert to weekly by multiplying by 7.
BLS oversamples weekends to account for day-of-week variation.
The full extraction and analysis code lives in two Jupyter notebooks in this
directory:
01_extraction.ipynb
(data download, schema parsing, activity-code mapping, CSV output) and
02_analysis.ipynb
(charts, tables, and findings). The extracted data is in
atus_extracted.csv.
The story you’ve heard: housework only
If you count only what the ATUS calls “household activities” — interior cleaning, laundry, cooking, food prep & cleanup, interior & exterior maintenance, lawn & garden care, pet care, vehicle & appliance repair, and household management — here’s what married couples with children look like:
| Men | Women | Women ÷ Men | |
|---|---|---|---|
| Housework & home maintenance | 9.8 hrs/wk | 18.7 hrs/wk | 1.9× |
Women do almost twice as much housework as men. This is the number behind most “men don’t share the housework” stories. It is accurate — but it is not the whole picture.
The story you don’t hear: everything else
Now add the rest of household production. The chart below shows what happens as you add categories one at a time — childcare, then market labor, then commute, then shopping & services, then non-household care & volunteering, then all travel:
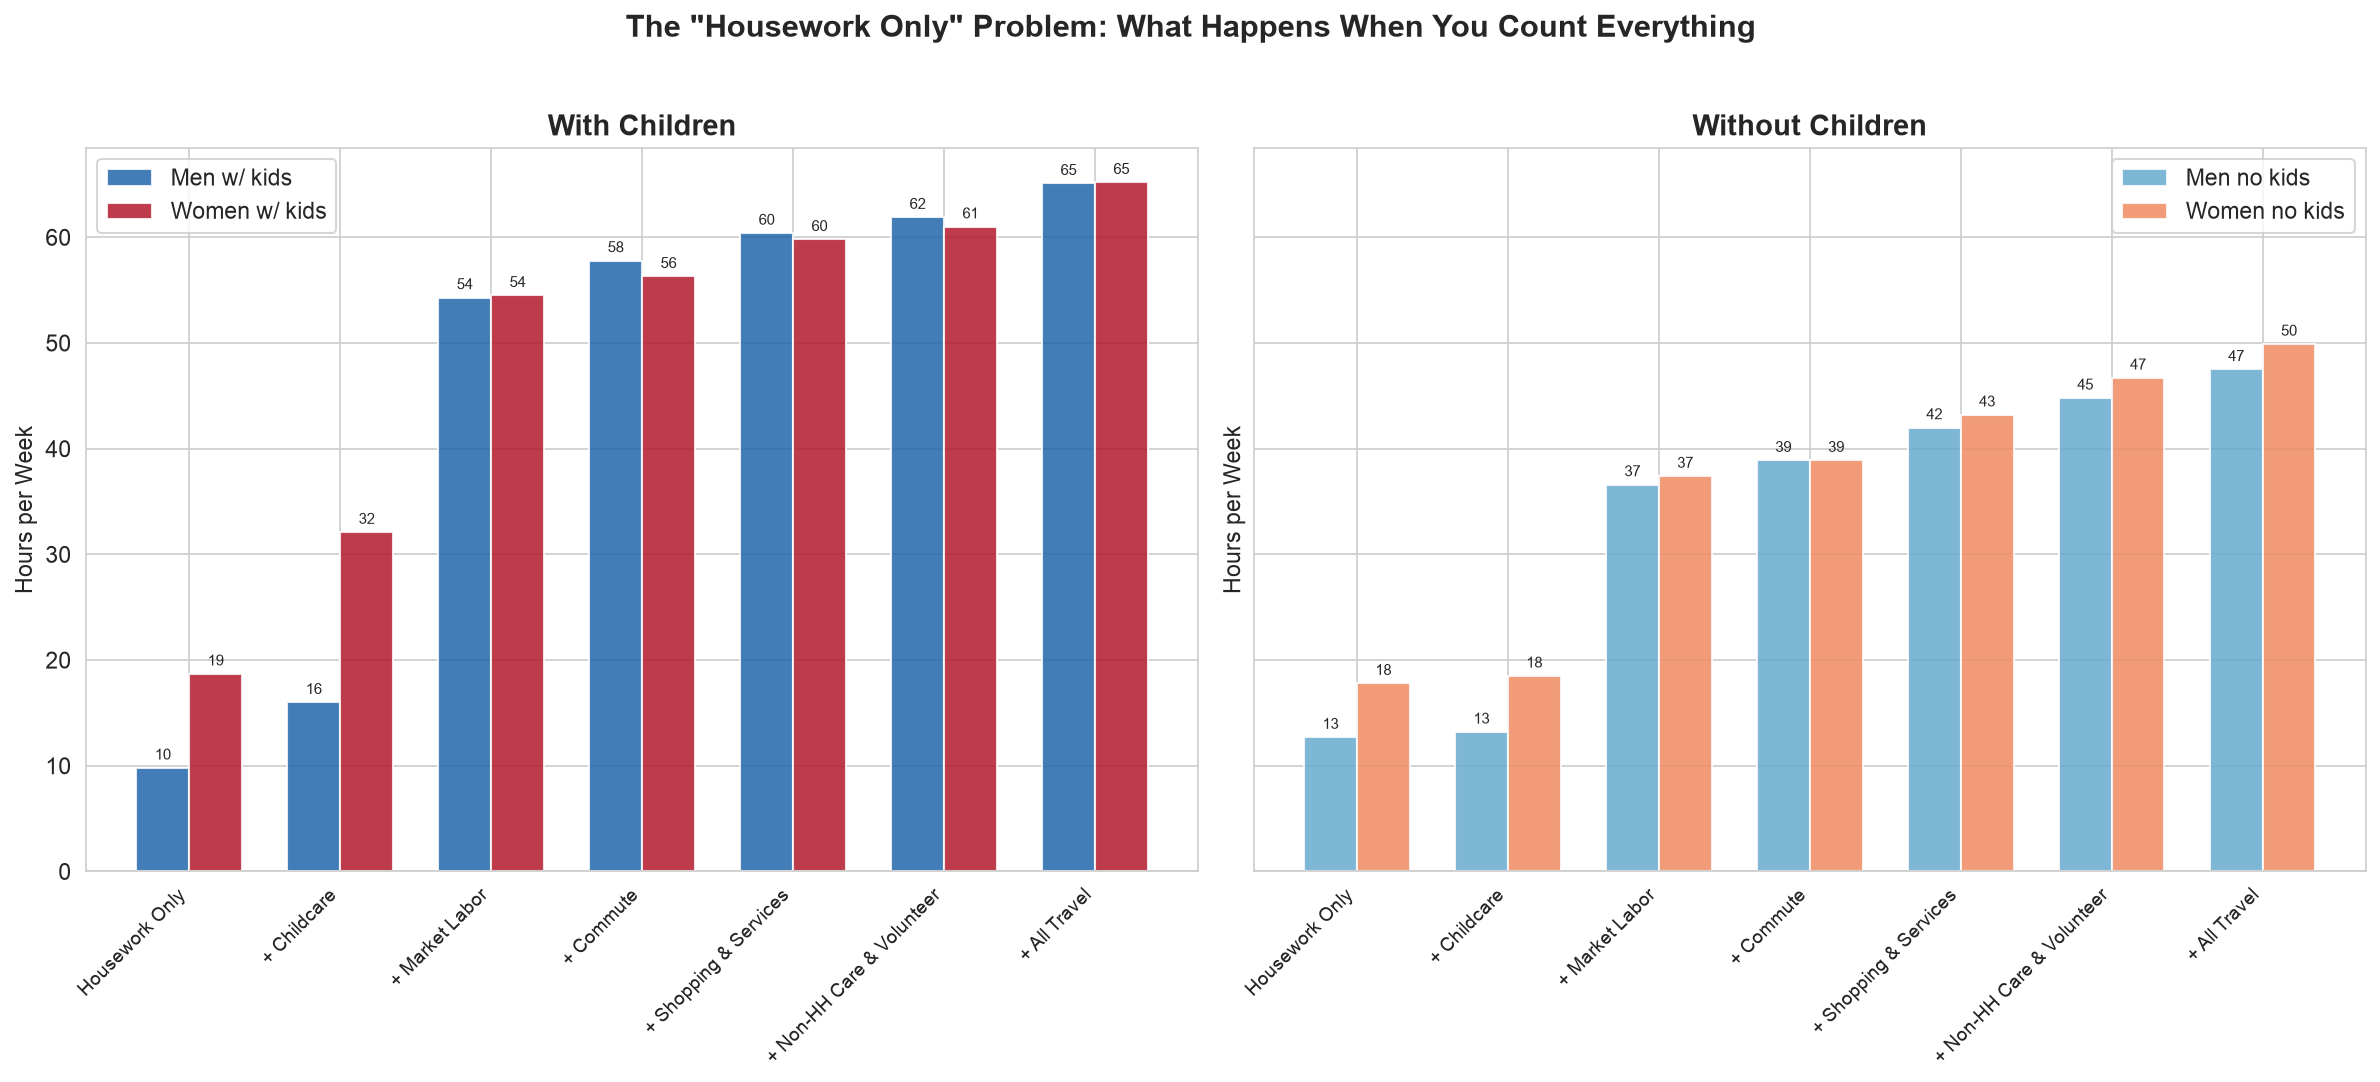
At each step, the ratio of women’s time to men’s time changes:
| What you count | Men (hrs/wk) | Women (hrs/wk) | Women ÷ Men |
|---|---|---|---|
| Housework only | 9.8 | 18.7 | 1.91× |
| + Childcare | 16.0 | 32.1 | 2.01× |
| + Market labor | 54.3 | 54.5 | 1.00× |
| + Commute | 57.6 | 51.5 | 0.89× |
| + Shopping & services | 60.0 | 55.3 | 0.92× |
| + Non-HH care & volunteer & civic | 61.6 | 56.0 | 0.91× |
| + All travel (total household production) | 65.1 | 65.2 | 1.00× |
Adding childcare makes the gap wider — women do more childcare too. But adding market labor closes the gap entirely, because married men with children spend 38 hours a week at work plus 3.5 hours commuting, while married women with children spend 22 hours at work plus 1.8 hours commuting. Once you count earning the income that pays for the household — including the commute — the totals converge to 65 hours a week each, within rounding.
Where the time goes
The stacked charts below show the composition of household production for each group. The total bars are the same height — but the colors inside them are very different.
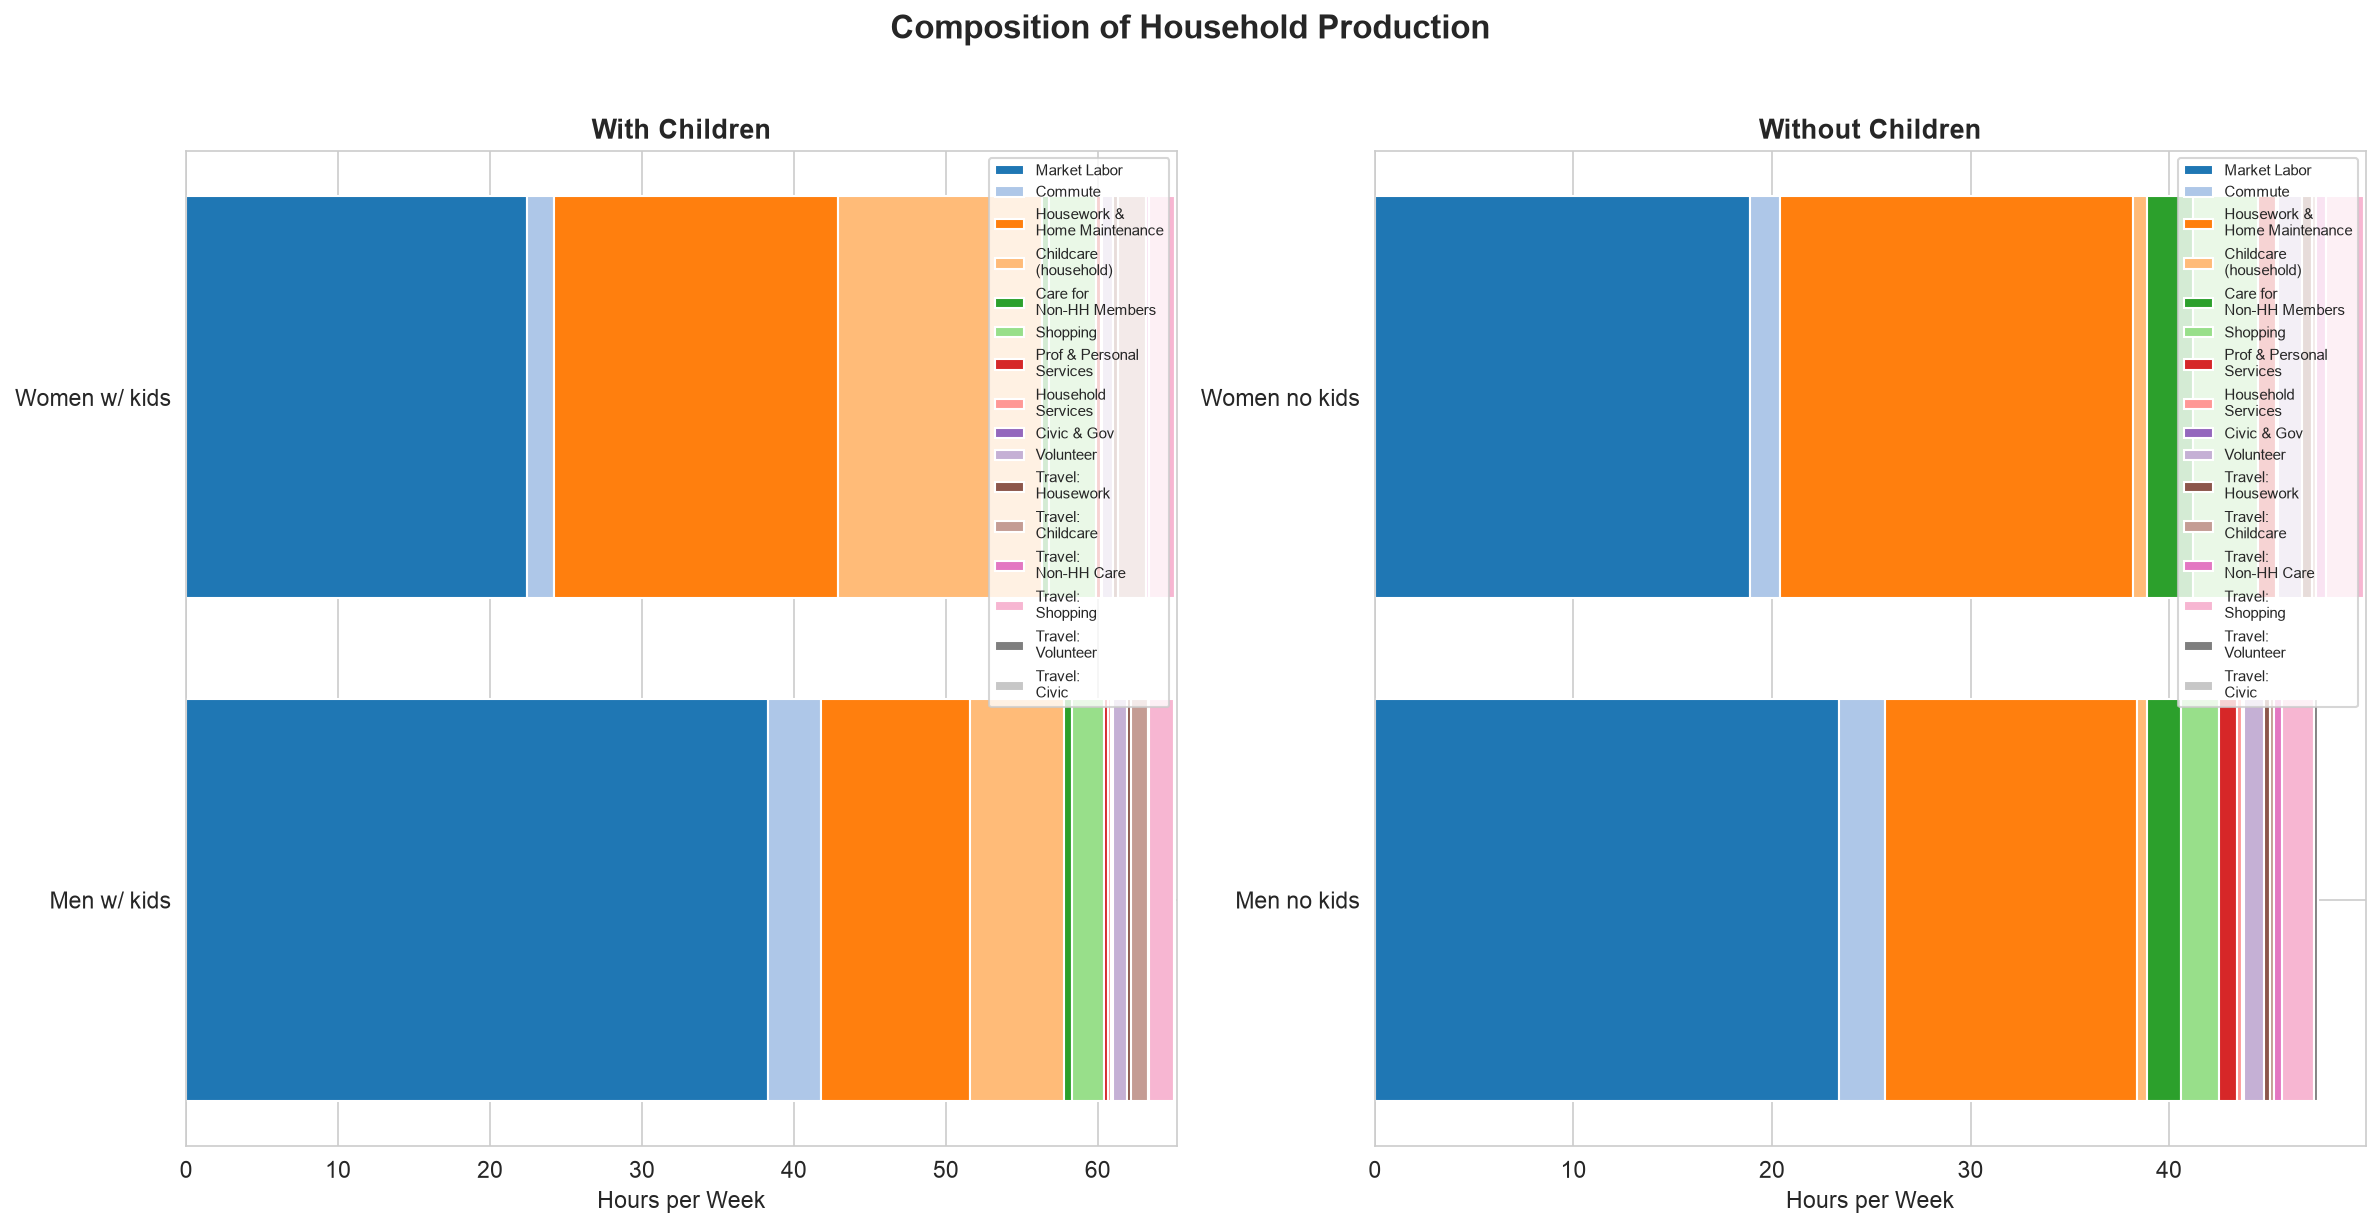
For couples with children, the big blocks are:
- Men: market labor (38.3 hrs) + commute (3.5 hrs) = 41.8 hrs, plus housework (9.8 hrs) and childcare (6.2 hrs)
- Women: market labor (22.4 hrs) + commute (1.8 hrs) = 24.2 hrs, plus housework (18.7 hrs) and childcare (13.4 hrs)
For couples without children, the pattern is similar but the totals diverge slightly — men do 47.5 hrs/week, women 50.0 hrs/week — because the childcare gap drops out and women’s housework advantage remains.
The gender gap, category by category
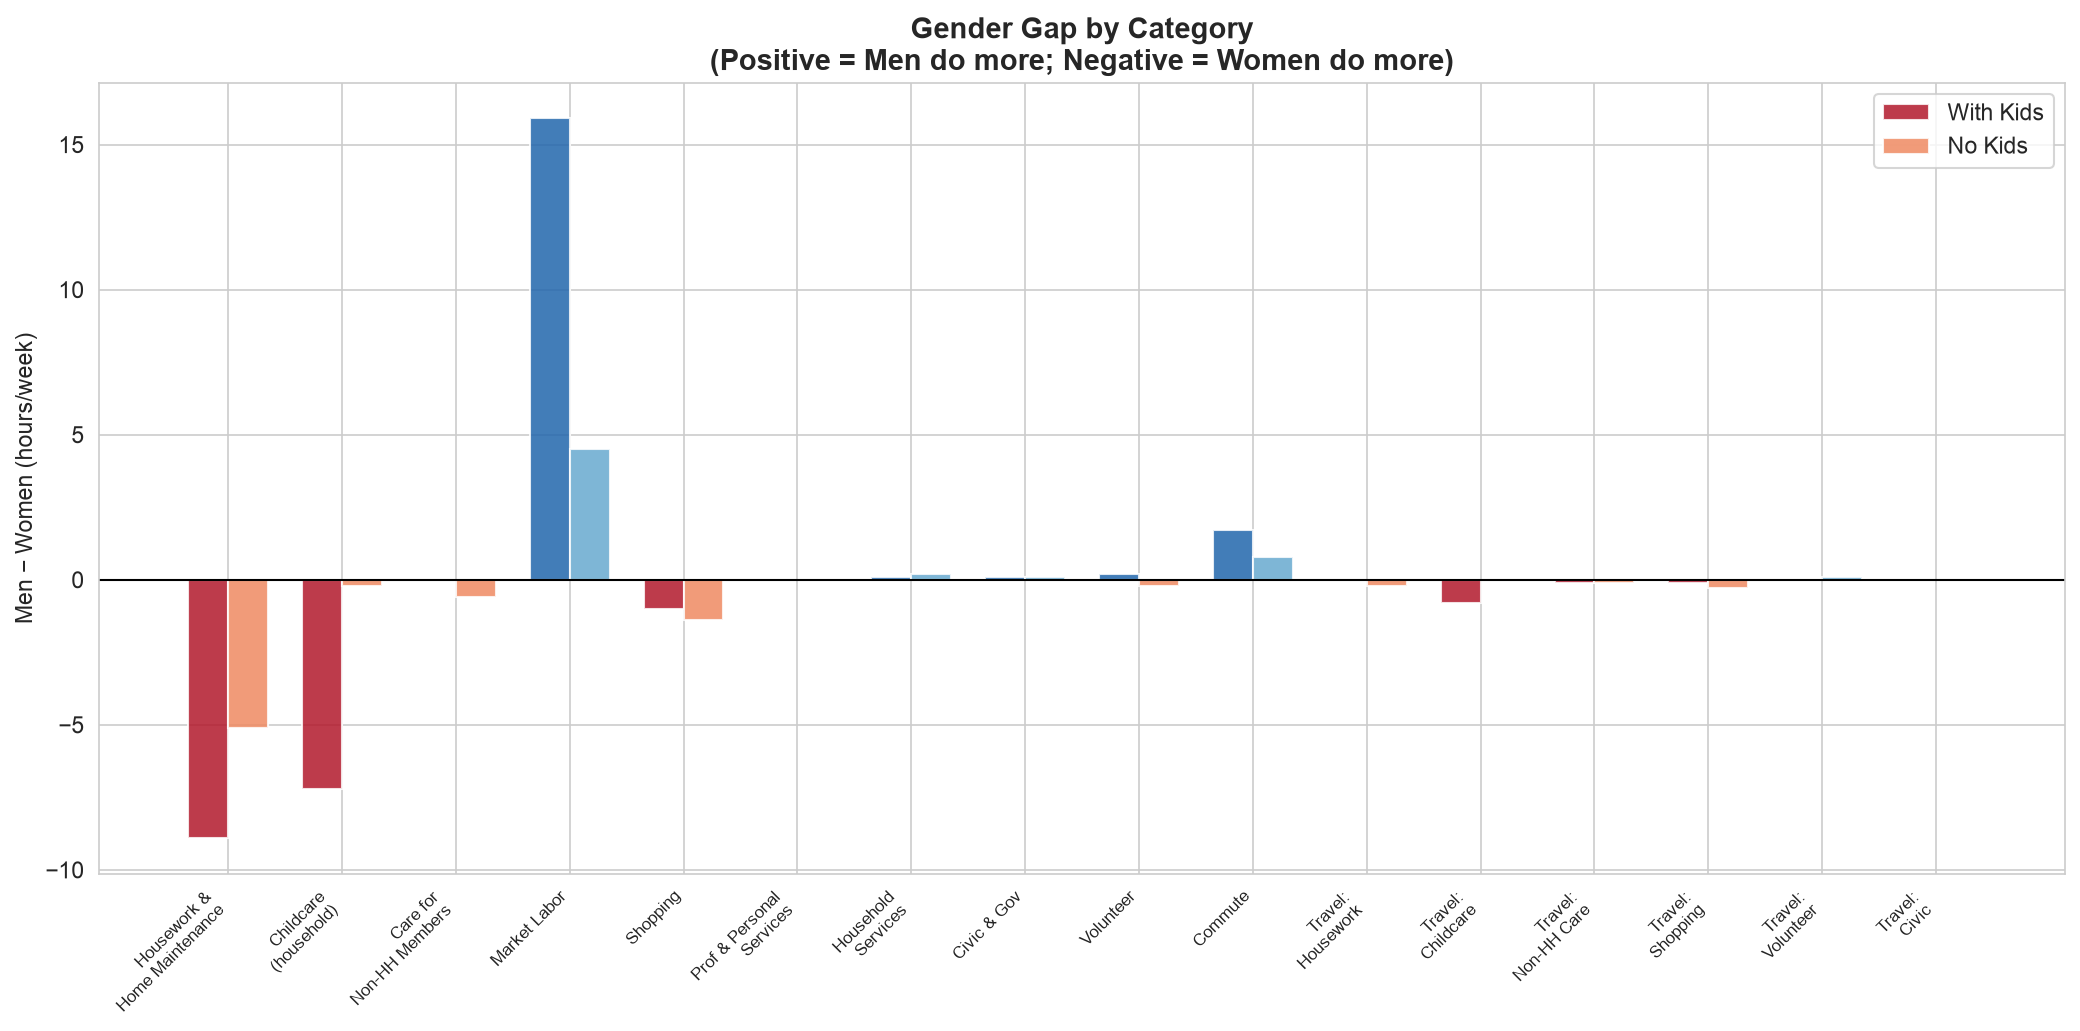
A positive bar means men spend more time; negative means women do. The pattern is clear: men dominate market labor and commute; women dominate housework and childcare. Shopping is roughly equal. Volunteering, services, and civic participation are small but slightly higher for men.
Men’s share within each category
For couples with children, what percentage of each activity does the man contribute?
| Activity | Men’s share | Men (hrs/wk) | Women (hrs/wk) |
|---|---|---|---|
| Market labor | 63% | 38.3 | 22.4 |
| Commute | 67% | 3.5 | 1.8 |
| Housework & home maintenance | 34% | 9.8 | 18.7 |
| Childcare (household) | 31% | 6.2 | 13.4 |
| Shopping | 40% | 2.1 | 3.1 |
| Volunteering | 55% | 0.9 | 0.7 |
| Travel (childcare) | 36% | 1.1 | 1.9 |
| Total household production | 50% | 65.1 | 65.2 |
Men do two-thirds of the market labor and commute; women do two-thirds of the housework and childcare. These are large differences within categories — but they cancel out in the total. The question “who does more?” has a different answer depending on which activity you look at. Only when you aggregate across all of them does the answer become “neither — they do the same.”
The narrow vs. broad definition
The chart below makes the definitional point explicit. Four definitions of “household production,” from narrowest to broadest:
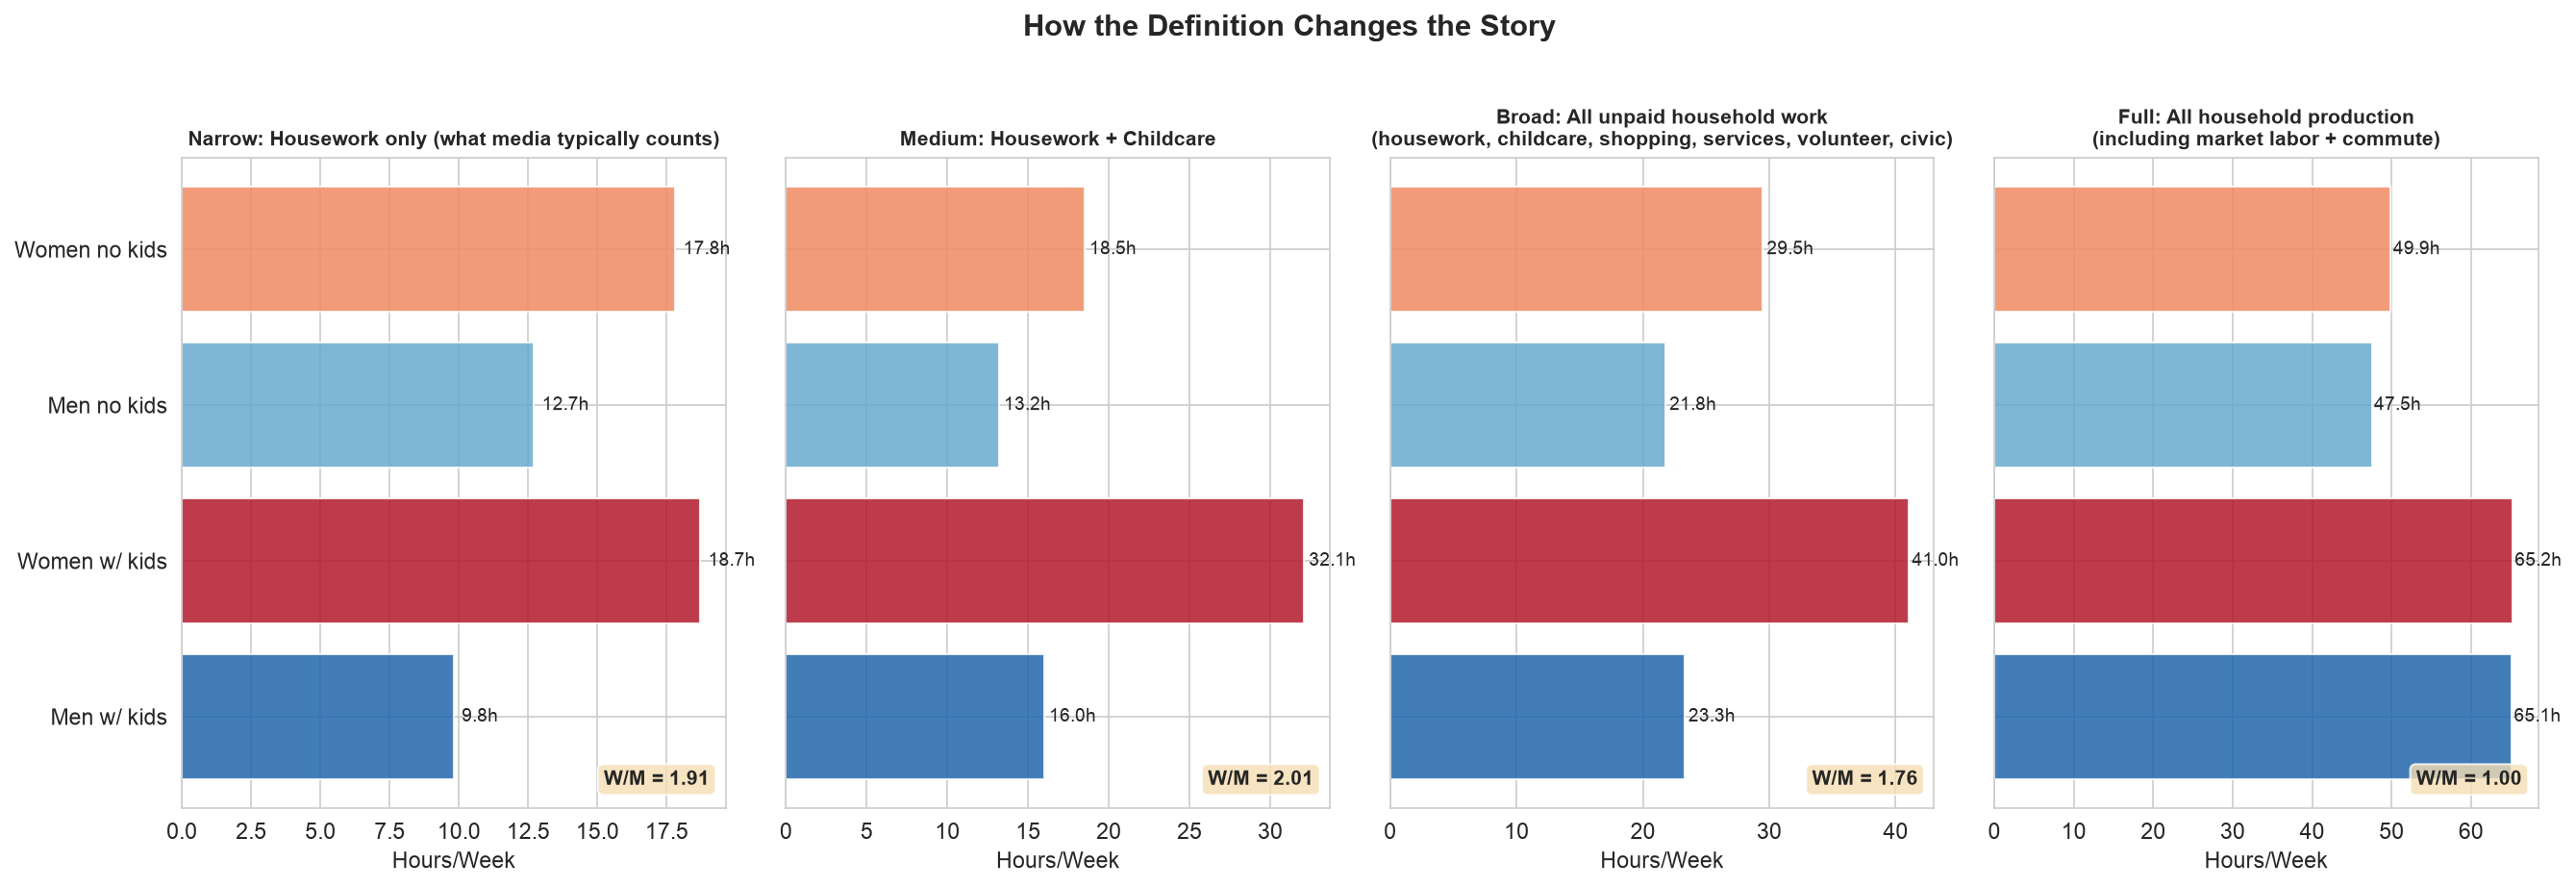
- Narrow (housework only): Women do 1.9× what men do. This is the number behind most media stories.
- Medium (housework + childcare): Women do 2.0× what men do. Adding childcare makes the gap wider, not narrower.
- Broad (all unpaid household work): Women do about 15% more than men. Even without counting market labor, the gap narrows when you include shopping, services, volunteering, and travel.
- Full (including market labor + commute): Parity. Men and women with children contribute the same total time to household production.
The ratio in the corner of each panel (W/M) tells the story: 1.91 → 2.01 → 1.17 → 1.00. The definition determines the conclusion.
Distributions, not just means
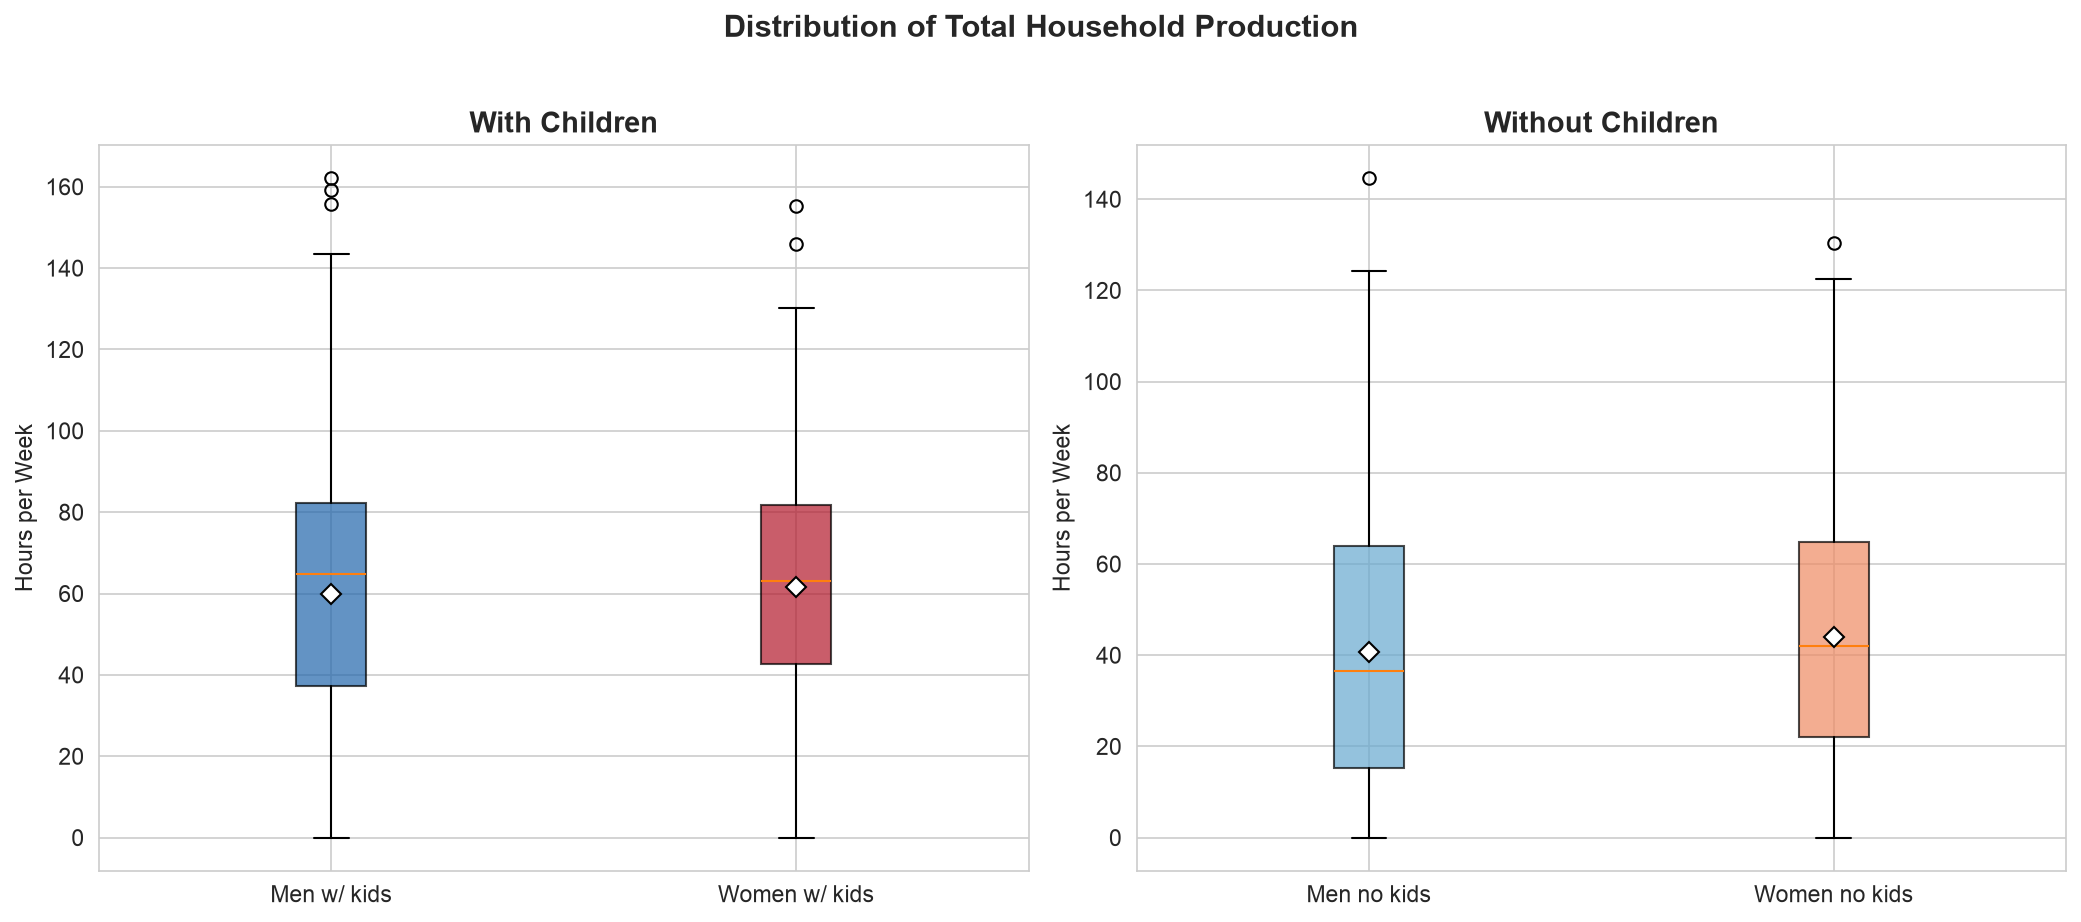
The means are nearly identical, but what about the spread? The box plots below show the distribution of total household production for each group. The medians (middle line) are close for all four groups, and the spread overlaps substantially — there are plenty of women who do more than the median man, and vice versa.
Takeaways
The “men don’t share the housework” story is incomplete. It is true that married women do nearly twice as much housework as married men. But housework is only one component of household production. When you count everything a couple must do to maintain a household, the total is the same.
The difference is in the composition, not the total. Married men with children spend ~65 hours a week on household production; married women with children spend ~65 hours a week. Men contribute through market labor (38 hrs) and commute (3.5 hrs); women contribute through housework (19 hrs) and childcare (13 hrs). Both are essential to maintaining a household.
The definition determines the conclusion. If you count only housework, women do 1.9× what men do. If you count housework + childcare, it’s 2.0×. If you add market labor and commute, it’s parity. The choice of what to include is not a technical detail — it is the entire argument.
This does not mean the division is equal in every household. These are group averages. Individual couples vary, and the distributions overlap substantially. Some couples have a more equal division than the averages suggest; some have a less equal one.
It also does not mean the current division is optimal. A couple might be better served by a more balanced allocation — for instance, if the man reduced his market hours and increased his housework and childcare, the woman could increase her market labor. Whether that would increase or decrease total household production (or welfare) is a separate question this analysis does not answer.
Limitations
- Single diary day: ATUS measures one day per respondent. Weekly estimates assume that day is representative, though BLS oversamples weekends to mitigate day-of-week bias.
- Secondary childcare: ATUS tracks secondary childcare (child present while doing other activities) separately. This analysis uses only primary activity time. Parents (especially mothers) likely provide more childcare as a secondary activity.
- Within-couple variation: We compare married men and married women as groups, not actual couples. Some couples may have a more equal division than the group averages suggest.
- Market labor ≠ “fun”: Including market labor in household production is defensible because income is essential to maintaining a household. However, many people derive satisfaction from their jobs, so not all work hours are “burden.” The same is true of some childcare and volunteering.
- Pre-pandemic data: ATUS 2018 is the most recent pre-pandemic year. Work-from-home has increased since 2020, which may have shifted the commute and market labor categories.
Sources
- Bureau of Labor Statistics — American Time Use Survey
- ATUS 2018 Coding Lexicon (PDF)
- ATUS User’s Guide (PDF)
- ATUS Data Files (BLS blocks automated downloads; this analysis uses a GitHub mirror of the same files)
The analysis above is generated by
01_extraction.ipynb
(data extraction) and
02_analysis.ipynb
(charts and tables), with the extracted data in
atus_extracted.csv.
View on GitHub to inspect or run.