Scenario. A founder owns 20% of a publicly traded company with a market cap of $5B. Over one year the company grows to $7B. The founder’s paper gain is $400M and a 20% annual mark-to-market tax produces an $80M cash bill. He has no other liquid wealth — his stake is his wealth.
He has to sell stock to pay the tax. The question this notebook tries to answer: how much of the tax does he actually pay, once you include the price impact of forcing $80M of insider supply through a stock that trades $30–$50M a day?
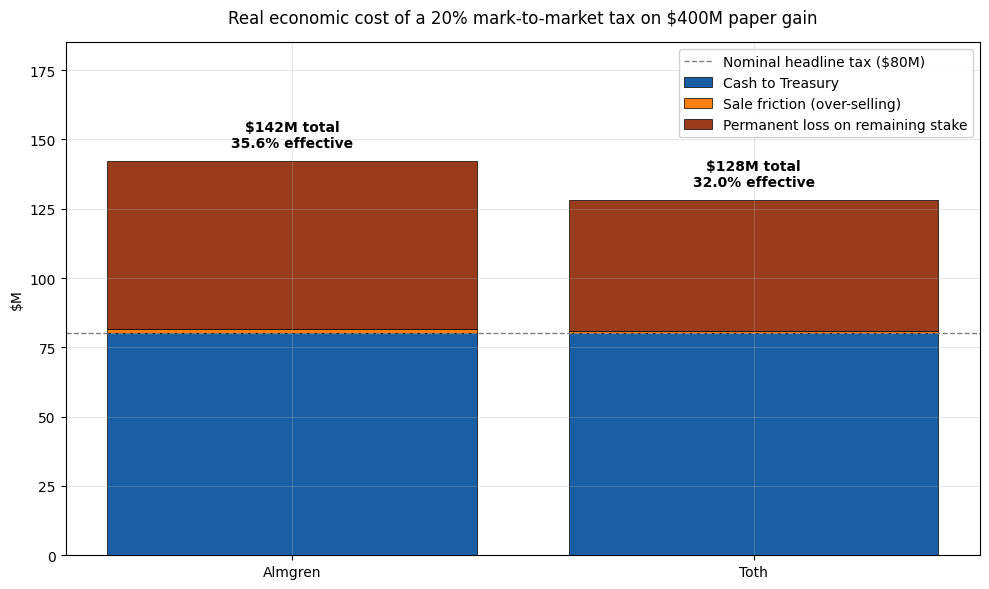
Short version: the headline 20% tax rate on his paper gain ends up costing him 30–35% of the gain in real economic terms — about 1.5–1.7× the nominal rate — because every dollar of forced selling permanently lowers the value of the stock he still owns.
A note on the model
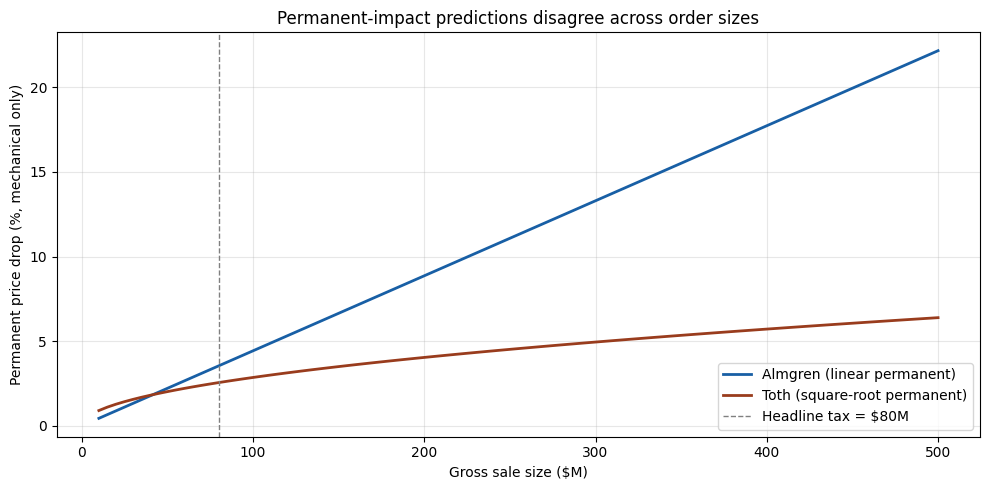
Two serious bodies of empirical work disagree about the shape of the permanent-impact function. The qualitative story (forced selling produces nontrivial permanent value destruction) holds under both. The exact multiplier on the headline tax depends on which model you pick.
Almgren, Thum, Hauptmann & Li (2005) — ~30k Citigroup institutional brokerage orders. They explicitly reject the square-root model. From their abstract: “We reject the common square-root model for temporary impact as function of trade rate, in favor of a 3/5 power law across the range of order sizes considered.” For permanent impact they find a linear function of order size with a turnover correction: $$I = \gamma,\sigma,\frac{X}{V}\left(\frac{\Theta}{V}\right)^{1/4}, \qquad J - \frac{I}{2} = \eta,\sigma\left(\frac{X}{VT}\right)^{3/5}$$ with γ = 0.314, η = 0.142. I is the permanent price drop, J is the average realized cost on the trade, X is order size, V is daily volume, Θ is shares outstanding, T is execution duration in days, σ is daily volatility.
Tóth, Lemperière, Deremble, de Lataillade, Kockelkoren & Bouchaud (2011, Phys. Rev. X) — derive a square-root impact law from a latent order book model and provide additional empirical support from CFM’s own trade data. They build on a long line of earlier work (Loeb 1983; Barra 1997; Lillo, Farmer & Mantegna 2003, Nature; Bouchaud, Gefen, Potters & Wyart 2004) that found concave power-law impact, often consistent with $\sqrt{X/V}$. The square-root law is widely treated as the industry workhorse.
We compute under both models and present them side by side. They disagree by roughly 2× on the permanent impact at our headline order size, which is why we don’t claim a single “right” effective tax rate.
Both papers’ calibrations are based on orders ≤ a few percent of daily volume. Our scenario pushes orders of ~160% of daily volume — well outside both calibration ranges. The numbers below should be read as order-of-magnitude estimates, not precise predictions.
Step 1 — the headline tax bill
Founder stake at year start:    $  1,000,000,000
Founder stake at year end:      $  1,400,000,000
Paper gain on the year:         $    400,000,000
Tax owed at 20%:                $     80,000,000
Step 2 — how big is that sale relative to normal trading?
Average daily dollar volume:      $     49,000,000
Volume over 60-day horizon:        $  2,940,000,000

Tax bill as % of company:                   1.14%
Tax bill in days of volume:                   1.6 days
Tax bill as % of horizon volume:            2.72%

Rule 144 1%-of-shares cap:          $   70,000,000
Rule 144 weekly-volume cap:         $  245,000,000
Effective Rule 144 cap (greater):   $  245,000,000
Tax bill / Rule-144 cap:                       0.33x  (>1 means more than one quarter required)
Step 3 — price impact under the Almgren and Tóth models
Note the model choice: Almgren’s permanent impact is linear in order size, not square-root. The 3/5 exponent shows up only in temporary impact. For comparison we also compute a Tóth-style square-root model. Both add a 1% permanent insider-signaling discount on top of the mechanical impact.
Almgren (linear perm, 3/5 temp):  permanent =  4.54%,  realized cost J =  1.81%
Toth    (square-root perm)    :  permanent =  3.56%,  realized cost J =  1.28%
Step 4 — gross sale needed to net the tax owed
Selling pushes the price down during execution, so the founder must sell more than $80M of stock at pre-trade prices to net $80M of cash. Solve for the gross sale Q such that Q × (1 − J(Q)) = $80M under each model.
--- Almgren model ---
  Gross stock sold:    $    81,498,415
  Friction (Q - tax):  $     1,498,415
  Realized cost J:              1.84%
  Permanent impact:             4.61%

--- Toth model ---
  Gross stock sold:    $    81,042,243
  Friction (Q - tax):  $     1,042,243
  Realized cost J:              1.29%
  Permanent impact:             3.57%
Step 5 — the loss on the shares he still holds
After the sale, the permanent impact stays in the stock price. His remaining shares are worth permanently less. That value destruction is not on his tax return, but it is the largest hidden cost of this whole exercise.
--- Almgren ---
  Ownership sold:                 1.16% of company
  Remaining ownership:            18.84%
  Remaining stake pre-impact:     $ 1,318,501,585
  Remaining stake post-impact:    $ 1,257,704,301
  Value destroyed on remainder:   $    60,797,284

--- Toth ---
  Ownership sold:                 1.16% of company
  Remaining ownership:            18.84%
  Remaining stake pre-impact:     $ 1,318,957,757
  Remaining stake post-impact:    $ 1,271,843,280
  Value destroyed on remainder:   $    47,114,477
Step 6 — total economic cost vs. headline tax bill
  Model  Cash to Treasury ($M)  Sale friction ($M)  Permanent loss on remaining stake ($M)  Total cost ($M) Effective rate on gain Multiple of nominal
Almgren                   80.0            1.498415                               60.797284       142.295699                  35.6%               1.78x
   Toth                   80.0            1.042243                               47.114477       128.156720                  32.0%               1.60x
Charts
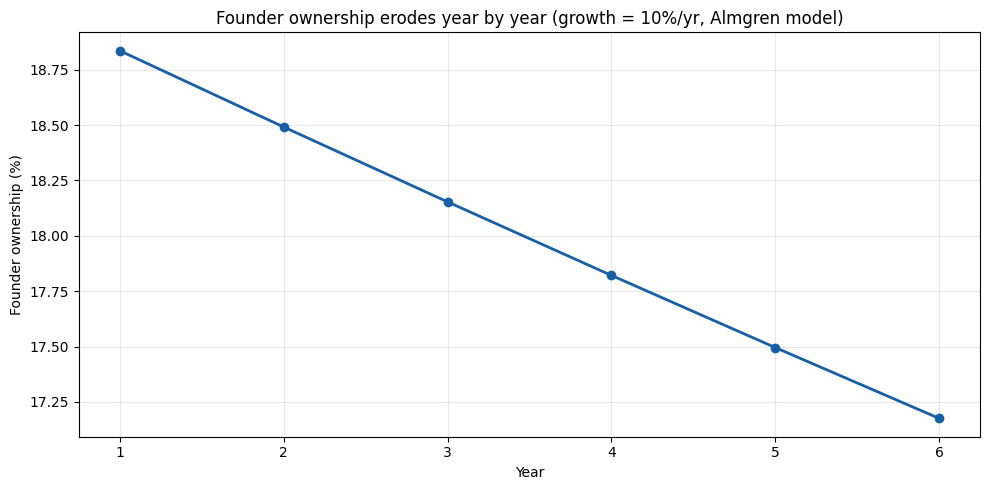
 Year  Mkt cap end ($M)  Ownership (%)  Tax owed ($M)  Economic cost ($M)  Eff. rate on gain (%)
    1            7000.0           18.8           80.0               142.3                   35.6
    2            7540.8           18.5           26.4                56.0                   42.4
    3            8124.9           18.2           27.9                58.9                   42.2
    4            8756.1           17.8           29.5                62.0                   42.0
    5            9438.0           17.5           31.2                65.2                   41.8
    6           10175.1           17.2           33.0                68.7                   41.6
Takeaways
- The $80M nominal tax bill costs the founder $120M–$140M in real economic terms, depending on which empirical impact model you use. Either way the hidden value-destruction on his remaining stake is comparable to or larger than the cash paid to the Treasury.
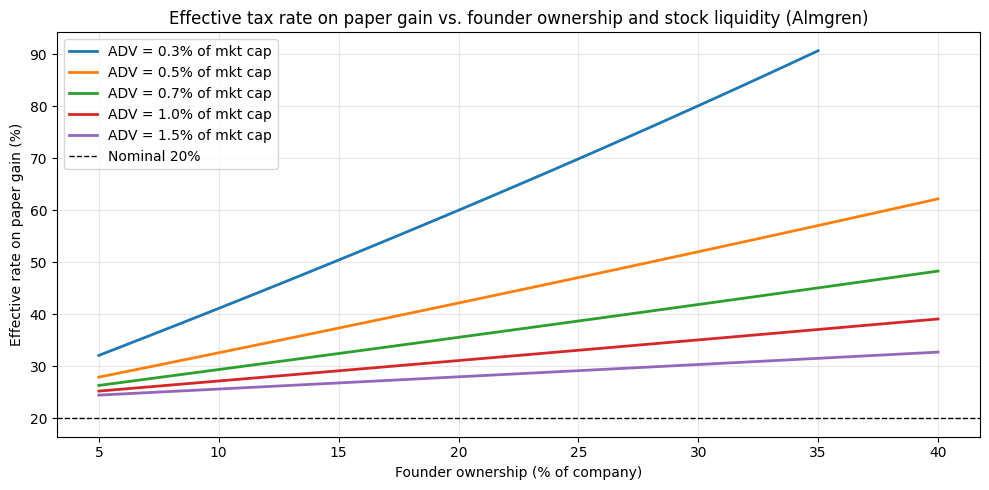
- The effective tax rate on his paper gain is ~30–35%, not 20%. And it climbs sharply as the company gets smaller, the founder owns more, or the stock is less liquid — exactly the households the proposal is supposed to target.
- The model uncertainty is real. Almgren et al. (2005) reject the square-root law; Tóth et al. (2011) derive it from a latent-order-book model. Both are serious empirical work. Our scenario (~160% of daily volume in a single tax year) is well outside both papers’ calibration ranges. The qualitative story is robust to model choice; the precise multiplier on the headline tax is not.
- Rule 144 doesn’t bind for a normally liquid $5–7B stock (the weekly-volume cap is roughly $245M, comfortably above the $80M sale). But it does bind for thinly traded names: cut ADV below ~0.3% of market cap and the founder runs out of legal selling capacity inside one quarter.
- Other shareholders pay too. The permanent price drop applies to everyone who owns the stock — index funds, pension plans, retail. A wealth tax on the founder is, in part, a value transfer from every other holder of the same security to the Treasury.
- Compounding. If the company keeps growing, the same dance repeats every year. Ownership erodes monotonically; the founder loses control of the company on a fixed schedule independent of business performance.
Caveats
- Almgren et al. (2005) explicitly reject the square-root law for temporary impact (β = 0.600 ± 0.038 vs. 1/2), and find permanent impact linear in order size with a (Θ/V)^¼ turnover correction. We use their actual functional form here, not the “square root” caricature sometimes attributed to them.
- The square-root law is well-supported by a separate and equally serious body of work — most prominently Tóth et al. (2011, Phys. Rev. X), which derives it from a latent-order-book mechanism. Earlier supporting work includes Loeb (1983), Barra (1997), Lillo, Farmer & Mantegna (2003), and Bouchaud, Gefen, Potters & Wyart (2004). We compute under both models and show the disagreement.
- The +1% insider-signaling permanent discount is a stylized addition above mechanical impact. Pre-announced 10b5-1 plan sales attract less; surprise insider supply attracts more.
- Both calibrations are for orders ≤ a few percent of daily volume. Our scenario is at ~160% of daily volume. Read the numbers as order-of-magnitude estimates, not point predictions.
Sources
- Almgren, R., Thum, C., Hauptmann, E., & Li, H. (2005). Direct estimation of equity market impact. (PDF) — fits linear permanent impact, rejects the square-root model for temporary impact in favor of β = 3/5.
- Tóth, B., Lemperière, Y., Deremble, C., de Lataillade, J., Kockelkoren, J., & Bouchaud, J.-P. (2011). Anomalous price impact and the critical nature of liquidity in financial markets. Phys. Rev. X 1, 021006. (arXiv 1105.1694) — derives the square-root law from a latent-order-book mechanism.
- Lillo, F., Farmer, J. D., & Mantegna, R. N. (2003). Master curve for price-impact function. Nature 421, 129–130.
- Bouchaud, J.-P., Gefen, Y., Potters, M., & Wyart, M. (2004). Fluctuations and response in financial markets. Quantitative Finance 4(2), 176–190.
- Frazzini, A., Israel, R., & Moskowitz, T. (2018). Trading costs. AQR working paper. (SSRN 3229719) — $1.7T of live trade data, finds real-world trading costs an order of magnitude lower than prior literature.
- SEC Rule 144 — selling restricted and control securities (SEC.gov).
The simulation above is generated by public_company.ipynb. View the notebook on GitHub to inspect or run the code.